The short version
What is the AP Statistics and is it worth it?
AP Statistics is a fully digital exam: 42 multiple-choice questions in 90 minutes and four free-response questions in 90 minutes. Scored 1-5, a 3 generally earns introductory statistics credit.
- Equivalent to a first-year college statistics course
- Widely useful across science, business, and social science
- Fully digital in Bluebook
- Calculator allowed throughout
What is it?
What exactly is the AP Statistics?
Earn intro college statistics credit with data, probability, and inference.
AP Statistics is a fully digital exam equivalent to a first-year college statistics course, covering exploratory data analysis, sampling and experimentation, probability, and statistical inference. It pairs 42 multiple-choice questions with four free-response questions that require a graphing calculator. A 3 typically earns credit for an introductory statistics course.
The path in brief
- Join AP Statistics via My AP
- Study the 5 CED units
- Practice FRQs with a graphing calculator
- Use AP Classroom progress checks
- Sit the fully digital exam in May
Before you book
Who is eligible to sit the AP Statistics?
Who it is for: High-school students needing statistics for any major
The test itself
What is the format of the AP Statistics?
The AP Statistics is administered by School-administered via Bluebook and runs 3 hours, contains 42 multiple choice + 4 free response questions and requires 3 (1-5 scale) to pass.
| Administered by | School-administered via Bluebook |
|---|---|
| Questions | 42 multiple choice + 4 free response |
| Time limit | 3 hours |
| Pass mark | 3 (1-5 scale) |
| Exam fee | $99 (US) / $129 (intl) |
| Format | Fully digital |
Content outline
What topics are on the AP Statistics?
The AP Statistics is weighted across 5 domains; the largest are Unit 1: Exploring One-Variable Data (20-30%), Unit 2: Probability and Distributions (15-25%), Unit 3: Inference for Proportions (15-25%).
Weightings come from the official exam outline. Study time is best allocated in roughly these proportions rather than evenly across domains.
- Unit 1: Exploring One-Variable Data 20-30%
Graphs, distributions
- Unit 2: Probability and Distributions 15-25%
Random variables
- Unit 3: Inference for Proportions 15-25%
Categorical data
- Unit 4: Inference for Means 10-20%
Quantitative data
- Unit 5: Regression Inference 10-20%
Bivariate data
Money & time
How much does the AP Statistics cost?
For the AP Statistics, the exam fee is $99 (US) / $129 (intl); the all-in cost is typically $99-$169; most candidates spend 1 school year preparing.
Cost breakdown
| AP exam fee (US, territories, Canada, DoDEA) | $99 |
|---|---|
| AP exam fee (international) | $129 |
| Late order or unused/canceled exam | $40 |
| Fee reduction for eligible students | -$37 |
| Prep materials (optional) | $0-$40 |
| Typical total | $99 US / $129 intl (eligible students pay ~$53 / ~$83); late or canceled adds $40 |
Fees are the 2025-26 AP charges. Schools may add a local administrative fee; the College Board fee reduction lowers the base by $37.
Timeline
- Enroll in the AP course Fall
- Study the five units Aug-May
- Practice FRQs with a calculator 2-3 months
- Take the digital exam May
- Receive scores Early July
Typical prep: 1 school year
The path
How do you register for the AP Statistics?
- 1
Create a College Board account10 minutes
Register at collegeboard.org with your legal name exactly as it appears on the photo ID you will bring on test day. One account covers the SAT, the PSAT-related assessments, AP and BigFuture.
- 2
Choose a weekend SAT date or let your school register you20 minutes
The SAT is booked directly by the student for weekend national administrations. PSAT 8/9, PSAT 10 and the PSAT/NMSQT are ordered and scheduled by the school, so for those you speak to your counselor rather than registering yourself.
- 3
Pay the fee or claim a fee waiver5 minutes
The US SAT registration fee is 68 dollars; international test takers add a regional fee of 43 dollars and, at some centres, a further test centre fee. Eligible US students get the SAT free through a counsellor-issued fee waiver, which also unlocks unlimited free score sends.
- 4
Install Bluebook and complete exam setup30 minutes
Download the free Bluebook app to your own laptop or tablet, or use a school-managed device, then run exam setup in the five days before test day to download the test and get your admission ticket.
Students who skip exam setup can be turned away or delayed at check-in.
- 5
Practise with Bluebook full-length tests and Khan Academy4 to 12 weeks
Six free adaptive full-length practice tests sit inside Bluebook, and Official Digital SAT Prep on Khan Academy is free and keyed to the same content domains.
- 6
Test, then review scores onlinetest day
Arrive with your admission ticket, acceptable photo ID and a charged device. Scores post to your College Board account, typically within about two weeks for weekend SAT dates.
The fine print
What are the retake and renewal rules for the AP Statistics?
- Proctoring & delivery
- All SAT Suite tests are taken in Bluebook on a laptop or tablet, in a school or an authorised weekend test centre, under a live human proctor. There is no at-home option. Bluebook locks the device, and a built-in Desmos graphing calculator and formula sheet are available throughout the Math section; you may also bring your own approved non-CAS calculator.
- Retake policy
- There is no limit on SAT attempts and no mandatory waiting period beyond the eight national dates offered each year. The PSAT-related assessments are given once per school year per grade band and are not retaken on demand. Most selective colleges superscore across SAT sittings, taking your best Reading and Writing score and your best Math score.
- Score reporting
- The SAT reports a 400 to 1600 total built from two 200 to 800 section scores. The PSAT/NMSQT and PSAT 10 report 320 to 1520 with 160 to 760 sections, and the PSAT 8/9 reports 240 to 1440 with 120 to 720 sections, so results across the suite sit on one comparable scale. PSAT/NMSQT reports also carry an NMSC Selection Index of 48 to 228.
- Recertification
- SAT Suite scores do not expire and never need renewal, but colleges commonly ask for a score from within the last five years and most students test in the spring of eleventh grade and again in the autumn of twelfth grade. Only a PSAT/NMSQT taken in eleventh grade enters the National Merit competition.
- Refunds & rescheduling
- Cancelling an SAT registration by the change deadline costs 34 dollars; cancelling after the deadline but before test day costs 44 dollars. Changing test centre costs 34 dollars, and late registration costs 38 dollars. Fee-waiver students are not charged for cancellation or late registration.
Context
The digital SAT Suite compared
| Assessment | Grades | Score scale | Length | |
|---|---|---|---|---|
| PSAT 8/9 | 8 and 9 | 240 to 1440 | 2h 14m | |
| PSAT 10 | 10 (spring) | 320 to 1520 | 2h 14m | |
| PSAT/NMSQT | 10 and 11 (autumn) | 320 to 1520 | 2h 14m | |
| SAT | 11 and 12 | 400 to 1600 | 2h 14m |
What it pays
How much does this credential pay?
AP Statistics has no direct salary outcome — its value is college credit and placement, and the earnings impact flows through the bachelor’s-degree premium and data-literate career paths.
The salary answer for AP Statistics is the college-credit story shared by AP exams with a data-literacy twist: the BLS does not publish a wage for AP scores because the AP program is a college-credit and placement system, but statistics is the gateway course for data-analytics, business, economics, and quantitative majors, and those fields carry strong BLS wage profiles — data scientists earned a May 2024 median of $112,590 and financial analysts $101,350. A qualifying AP Statistics score (3 or higher, depending on the college) earns credit toward the introductory statistics requirement that nearly every major includes, which saves tuition and schedule pressure; a 4 or 5 at selective schools can satisfy the requirement entirely. AP Statistics is one of the largest AP exams, with roughly 260,000 test-takers per year, and colleges accept it widely for credit and placement because statistics is a general-education requirement. The exam is 3 hours: a multiple-choice section (40 questions, 90 minutes) and a free-response section (6 questions, 90 minutes, including one investigative task), scored 1-5, with a scientific or graphing calculator permitted. The honest caveat is that credit policies vary — some quantitative majors require an in-house statistics course regardless — so the score’s value depends on the specific college’s policy. For a candidate asking whether AP Statistics pays, the direct answer is that it pays through credit and placement at colleges that accept it, and it is one of the most broadly applicable AP credits because statistics is a near-universal requirement. The statistics career context reinforces the point: the BLS tracks data scientists at a May 2024 median of $112,590, financial analysts at $101,350, and the broader data-literate occupations, all of which require the college-level statistics foundation the AP credit accelerates — so the score’s value flows through both the tuition savings and the readiness for quantitative majors that carry these documented wage profiles.
| Measure | Figure | Source / note |
|---|---|---|
| Annual test-takers | ~260,000 | One of the largest AP exams (College Board) |
| Score scale | 1-5 | 3+ typically qualifies for credit; 4-5 at selective schools |
| Exam length | 3 hours | 40 MC (90 min) + 6 FRQs (90 min) |
| Salary impact | Indirect | College credit and placement; statistics is a near-universal requirement |
Job growth.AP Statistics volume tracks the growth of the AP program and data-driven majors; it remains a top-10 AP exam.
Your odds
What are the pass rates?
The College Board publishes AP Statistics score distributions, not pass rates; in recent cycles roughly three-fifths of test-takers scored 3+ (qualifying), with 4 and 5 concentrated in the top quarter.
The direct answer on pass rates requires precision: the College Board does not publish a "pass rate" for AP exams because scores are reported on a 1-5 scale and each college defines what qualifies, but the College Board does publish the annual score distribution for every AP subject, which is the closest published statistic. For AP Statistics in recent cycles, roughly three-fifths of test-takers scored 3 or higher — the score most colleges treat as qualifying — with the 4 and 5 scores concentrated in the top quarter of test-takers; the exact percentages shift modestly by year, and the College Board’s annual report is the authoritative source. The exam structure is fixed and published: 40 multiple-choice questions in 90 minutes (50 percent of the score) and 6 free-response questions in 90 minutes (50 percent), with the free responses including five standard items and one investigative task, and a scientific or graphing calculator permitted throughout. The content covers the four big ideas: exploring data (graphical and numerical summaries), sampling and experimentation (study design), anticipating patterns (probability and sampling distributions), and statistical inference (confidence intervals and significance tests). The practical read on difficulty: AP Statistics is less computation-heavy than it is reasoning-heavy — the free responses reward explaining the reasoning (why a design is biased, what a confidence interval means, how a p-value is interpreted) — and candidates who practice the explanation language score higher than candidates who only compute statistics. Because the credit value depends on the college’s policy, the smart approach is to check the target colleges’ AP credit tables and drill the free-response explanation formats.
Read this before quoting the number.The College Board publishes score distributions, not pass rates; whether a 3, 4, or 5 "passes" depends on each college’s AP credit policy.
Source: College Board AP score distribution report and AP Statistics exam description
Your schedule
How long should I study for it?
50-70 hours over 10-14 weeks of focused study
An efficient AP Statistics study plan is 50-70 hours over 10-14 weeks, because the exam is a reasoning-heavy test and the fastest score gains come from mastering the four big ideas while drilling the free-response explanation formats that carry half the score. The College Board course and exam description is the scope map: exploring data, sampling and experimentation, anticipating patterns, and statistical inference, with the multiple-choice section (40 questions, 90 minutes) and the free-response section (6 questions, 90 minutes) each worth 50 percent. The study window should split into content coverage (weeks 1-8) and free-response explanation drilling (weeks 9-12), followed by full practice exams (weeks 13-14): the free responses reward the reasoning — describing design flaws, interpreting confidence intervals, explaining p-values — and candidates who practice that language outperform candidates who only compute. Candidates taking the course in school should budget the lower end; self-studying candidates should budget the upper end and add a structured review book or course. The final two weeks should be full practice exams at the real format — 40 MC in 90 minutes and 6 FRQs in 90 minutes, with the calculator — because the pacing and the explanation writing are the two things candidates underestimate. A mid-plan checkpoint helps: after the content-coverage weeks, take a section-level multiple-choice set and one free response to measure whether the inference procedures and their conditions are automatic, because the exam rewards procedure selection and the remaining weeks should target the weak procedures before the explanation drilling phase. Candidates who keep an inference flowchart during coverage report faster gains in the final practice-exam phase.
- Week 1-420
Data and study design
- Study exploring data: graphs, center, spread, and shape
- Master sampling and experimentation: designs, bias, and randomization
- Practice identifying design flaws in scenarios
- Week 5-822
Probability and inference
- Study probability, random variables, and sampling distributions
- Master confidence intervals and significance tests
- Work the inference conditions for means and proportions
- Week 9-1116
Free-response explanation
- Drill the six FRQ formats: the interpretation and explanation language
- Practice the investigative task: a multi-part data analysis
- Do a full 40-MC + 6-FRQ practice exam
- Week 12-1412
Full exams and readiness
- Take two more full practice exams scoring 3+ then 4+
- Re-drill the missed topics and explanations until clean
- Confirm the exam-day logistics, calculator, and registration
Adjusting the pace
Taking the course in school.Budget the lower end; weight time toward the free-response explanation formats.
Self-study.Budget the upper end and add a structured review book or course for the inference content.
How to study
How do I prepare most effectively?
The dominant prep strategy for AP Statistics is mastering the four big ideas while drilling the free-response explanation language, because the exam rewards reasoning — describing designs, interpreting intervals, and explaining p-values — more than computation, and candidates who practice the explanation formats score higher. First, use the College Board course and exam description as the checklist: the four big ideas and the exam formats are published, and studying them in order with the list in hand is the highest-yield plan. Second, drill the free-response formats deliberately: the six FRQs include an investigative task, and the scoring rewards the interpretation and conclusion language — candidates should practice writing what a confidence interval means and what a p-value does and does not show. Third, master the inference conditions: the exam expects candidates to state and check the conditions for each procedure (random, normal, independent), and that checklist is highly coachable. Fourth, practice study-design items, because describing the flaw in a sampling or experimental design and fixing it is a recurring scored skill. Fifth, run full practice exams at the real timing — 40 MC in 90 minutes and 6 FRQs in 90 minutes — because the pacing and the writing load are the constraints candidates underestimate. Finally, confirm the target colleges’ AP credit policies, because the value of a 3 vs a 5 depends on where the score is sent. A further high-yield tactic is to build a one-page inference flowchart during study — which procedure, which conditions, which interpretation — because the exam tests procedure selection and the flowchart consolidates it.
Use the CED as the checklist
The four big ideas and formats are published; study in order.
Drill the explanation language
Practice interpreting intervals, p-values, and conclusions; the FRQs are scored on reasoning.
Master the inference conditions
Random, normal, independent — state and check them for every procedure.
Practice study-design items
Describing and fixing design flaws is a recurring scored skill.
Build an inference flowchart
Which procedure, which conditions, which interpretation — one page consolidates it.
What to buy
Which study resources are worth paying for?
AP Statistics prep resources split into the College Board official set, review books, and online courses, and the buying logic is anchored by the official materials because the College Board publishes the course and exam description, past free-response questions, scoring guidelines, and sample questions for free. The official free set — the CED and the past FRQs with scoring guidelines — defines the content and the reasoning standards precisely. Review books from major publishers, roughly $20-40, add structured coverage and practice exams. Online courses and question banks, $30-100, add video instruction and problem drilling. The footnote that anchors the comparison: prices below are list prices as of mid-2026 and change frequently, and we rank nothing by commission. The exam fee is about $99 per AP exam (plus any school or state fees), with fee reductions available for eligible students. A cheap readiness check is the free sample questions and one past FRQ set from the College Board before buying anything. Candidates should also verify the school’s AP exam registration process and deadline, because late registration fees are a common avoidable cost. The well-regarded review books track the current four-big-ideas framework and include full practice exams, and candidates should prefer an edition published after the most recent course update; the online courses that include past-FRQ explanation analysis add the most value because the interpretation language is where the score is won, and the free official materials should always come first. The well-regarded review books track the current four-big-ideas framework and include full practice exams, and candidates should prefer an edition published after the most recent course update; the online courses that include past-FRQ explanation analysis add the most value because the interpretation language is where the score is won, and the free official materials should always come first before any purchase, because the CED and the scoring guidelines define the reasoning standards precisely.
| Resource | Price | Format | Best for |
|---|---|---|---|
| College Board official materials | Free | CED + past FRQs + scoring guides | The authoritative content and scoring standards |
| AP Statistics review book | $20-40 | Book with unit reviews and practice | Structured coverage for any candidate |
| Online course / question bank | $30-100 | Video + drilling | Self-studiers wanting structure |
| AP exam registration | ~$99 | School/College Board | The real exam; fee reductions available |
List prices as of mid-2026 and change frequently; we rank nothing by commission. The AP exam fee is ~$99 with reductions for eligible students.
Avoid these
What mistakes do candidates most often make?
The most common mistake on AP Statistics is computing statistics without explaining the reasoning, because the free responses are scored on interpretation and conclusion language — candidates who give a p-value without interpreting it, or a confidence interval without stating its meaning, lose most of the credit; the second is confusing correlation with causation in the interpretation items. A third recurring error is skipping the inference conditions, when the exam expects candidates to state and check random, normal, and independent conditions for every procedure. Candidates also routinely mis-select procedures, using a t-test where a z-test or a matched-pairs design applies, when the exam rewards procedure selection. Another pattern is neglecting the investigative task, the multi-part free response that combines design, data, and inference skills. Finally, some candidates never run a full practice exam at the real 3-hour format, so the pacing and the writing load surprise them on test day. A further recurring error is stating conclusions without the evidence — a p-value without the context, or a confidence interval without its meaning — when the scoring rewards the full interpretation; others check the wrong conditions for the selected procedure, and some write the investigative task as a list of numbers rather than a reasoned analysis. Practicing the response structures against the scoring guidelines converts those losses into points. A further recurring error is stating conclusions without the evidence — a p-value without the context, or a confidence interval without its meaning — when the scoring rewards the full interpretation; others check the wrong conditions for the selected procedure, and some write the investigative task as a list of numbers rather than a reasoned analysis. Practicing the response structures against the scoring guidelines converts those losses into points, and candidates who build the inference flowchart during study find procedure selection automatic under the clock.
✕Computing without interpreting
✓Practice the interpretation and conclusion language; the FRQs are scored on reasoning.
✕Confusing correlation with causation
✓State the limits of observational data explicitly in the interpretation items.
✕Skipping the inference conditions
✓State and check random, normal, and independent conditions for every procedure.
✕Mis-selecting the procedure
✓Use the inference flowchart to choose between z/t, means/proportions, and paired designs.
✕Neglecting the investigative task
✓Practice the multi-part free response that combines design, data, and inference.
What you'll face
What question types will I see?
The AP Statistics exam is 3 hours: 40 multiple-choice questions in 90 minutes (50 percent) and 6 free-response questions in 90 minutes (50 percent), scored 1-5, with a scientific or graphing calculator permitted throughout. The free-response section has five standard items and one investigative task, covering the four big ideas: exploring data, sampling and experimentation, anticipating patterns, and statistical inference. The samples below illustrate three formats — a study-design MC item, an inference FRQ, and an investigative-task prompt. The sample items are editor-written illustrations of the published format, not live test items. The multiple-choice section tests design, probability, and procedure selection, often with brief scenarios; the five standard free responses cover the concepts and procedures, and the investigative task combines design, data, and inference in one multi-part analysis. The interpretation and conclusion language — what an interval means, what a p-value does and does not show — is scored throughout, so the response structure matters as much as the statistics. The multiple-choice section tests design, probability, and procedure selection, often with brief scenarios; the five standard free responses cover the concepts and procedures, and the investigative task combines design, data, and inference in one multi-part analysis. The interpretation and conclusion language — what an interval means, what a p-value does and does not show — is scored throughout, so the response structure matters as much as the statistics, and candidates should practice writing the conclusions in full sentences rather than fragments. The investigative task rewards a full arc — the design, the analysis, and the interpretation — and candidates who rehearse it against the past-FRQ materials find the multi-part format predictable, so the final practice-exam phase should always include at least one complete investigative-task rehearsal under the clock.
Study designs, probability, and procedure selection.
State conditions, run the procedure, interpret the result with conclusion language.
A multi-part data-analysis problem combining design, data, and inference.
Try these
Q1A researcher wants to estimate the average height of students at a large school. Which sampling method best avoids selection bias?
Answer:B
A simple random sample gives every student an equal chance of selection, avoiding the selection bias of convenience (first arrivals), voluntary (online), or non-representative (team) samples.
Q2Inference FRQ (illustrated): "A 95% confidence interval for a population mean is (12.4, 15.6). Interpret the interval in context."
Answer:B
The correct interpretation is about the population mean: we are 95% confident the population mean lies between the bounds. The other options confuse the interval with data coverage or overstate certainty.
Q3Investigative-task prompt (illustrated): "A company claims its batteries last longer than a competitor’s. Design a study to compare the two batteries, and describe how you would analyze the results."
Answer:A
The investigative task rewards the full design: a randomized comparative experiment (ideally paired or with proper controls) and the appropriate analysis (two-sample t or paired t-test). A claim or conclusion without a design and analysis earns little credit.
Samples are editor-written illustrations of the published format, not live test items.
The big day
What should I expect on exam day?
The AP Statistics exam is a paper-and-pencil test administered at your school on the College Board’s AP exam schedule, and the direct exam-day answer is that you will sit 40 multiple-choice questions in 90 minutes, then 6 free-response questions in 90 minutes, for a 3-hour exam scored 1-5, with scores released in July. Arrive with your school-issued admission ticket, a government-issued or school photo ID, and the permitted materials — No. 2 pencils for the multiple-choice section, black or blue pens for the free-response section, and an approved scientific or graphing calculator, per the College Board’s current rules; no notes or electronic devices are permitted. The exam begins with the multiple-choice section, then a brief break, then the free-response section; the proctor enforces strict timing, and the calculator is permitted throughout. Expect a controlled testing environment with other AP candidates; follow the proctor’s instructions exactly. In the multiple-choice section, pace to finish with review margin; in the free-response section, budget roughly 15 minutes per question and write the interpretation and conclusion language the scoring expects. Scores are released online in July through the College Board account. If the score falls short of the target colleges’ credit policy, the exam can be retaken the following year — AP exams are offered once per year. The free-response timing should be budgeted at roughly 15 minutes per question, with the investigative task getting the largest share, and candidates should write the interpretation and conclusion statements in full sentences rather than fragments; the calculator is permitted throughout, so practice the inference computations with it, and the July score release should be checked against each college’s AP credit table.
Bring
- School-issued AP admission ticket
- Photo ID (school or government issued)
- No. 2 pencils and black/blue pens per College Board rules
- Approved scientific or graphing calculator
Leave at home
- Notes and electronic devices (prohibited)
- Study materials
- Personal stationery (the booklet and materials are provided)
- Any item on the College Board prohibited list
How the day runs
Rules in the room
- No notes or electronic devices
- No. 2 pencils for multiple choice; black/blue pens for free response
- Calculator permitted throughout; confirm the current policy
- Strict proctor-enforced timing on both sections
Afterwards.Receive the 1-5 score in July, send it to colleges through the College Board, and check each college’s AP credit policy. The exam can be retaken the following year if the score falls short.
Reference
What are the key facts about the AP Statistics?
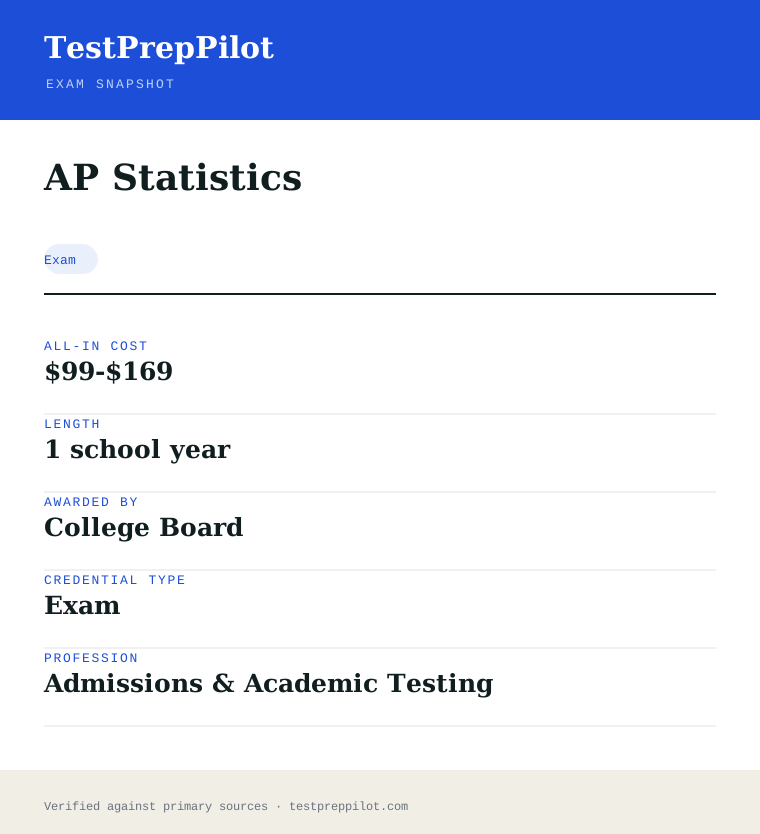
AP Statistics is a exam credential; awarded by College Board; the exam fee is $99 (US) / $129 (intl); typical preparation is 1 school year; holders typically earn College credit outcomes vary by school (3+ typically qualifies).
| Credential | AP Statistics |
|---|---|
| Abbreviation | AP Stats |
| Type | Exam |
| Profession | Admissions & Academic Testing |
| Specialty | Advanced Placement |
| Awarded by | College Board |
| Difficulty | Moderate |
| Typical prep time | 1 school year |
| All-in cost | $99-$169 |
| Typical salary range | College credit outcomes vary by school (3+ typically qualifies) |
| Score scale | 1 to 5 |
| Credit | 3+ typically earns intro statistics credit |
| Calculator | Graphing calculator required |
| Delivery | Fully digital in Bluebook |
| Exam timing | Early May |
| Scope | National / Multi-state |
Real questions
Frequently asked questions about the AP Statistics
How many credits is AP Statistics worth?
Most colleges grant three to four credits for a 3 or higher toward an introductory statistics requirement. Selective schools may require 4 or 5.
Is AP Statistics hard?
The math is not advanced, but the vocabulary of inference and the free-response justification are tricky. Practice explaining conclusions in context.
Stats or Calculus?
Statistics suits data-oriented fields; calculus suits engineering and physical science. Many students take both.
What score do I need for credit?
A 3 is the typical threshold; many universities want 4 or 5 for placement.
Can I self-study?
Yes, using the CED and a graphing calculator. Register for the exam through a school.
Why do all four SAT Suite tests take the same 2 hours 14 minutes?
Since the digital transition every assessment in the suite uses the same blueprint: 54 Reading and Writing questions in two 32-minute modules and 44 Math questions in two 35-minute modules. Difficulty is calibrated to the grade band rather than by adding or removing time.
Can I take an SAT Suite test at home?
No. Unlike some other admissions tests, every College Board digital assessment must be taken in a supervised school or test centre, even though it runs on your own device.
How do fee waivers work?
US students in eleventh or twelfth grade who meet income eligibility get SAT fee waivers from their school counsellor. A waiver covers the registration fee, waives cancellation and late fees, and gives unlimited free score reports to colleges.
In short
Is the AP Statistics worth it?
- Introductory college statistics
- 42 multiple-choice plus four free-response questions
- Fully digital in Bluebook
- Scored 1-5; a 3 generally earns credit
Same awarding body
What other credentials does College Board award?
Worth comparing
How does the AP Statistics compare with similar credentials?
Trust
Where does this information come from?
Everything above is taken from the awarding body's own published material. Fees, question counts and domain weights are revised regularly — check the official page before you pay.
- College Board Awarding body
- Official AP Statistics exam page Exam page
Research confidence: high · Last reviewed 2026-08